Plain numbers only. Use a dot or a comma for decimals, for example 88.5.
| # | Raw | Curved | Change | Letter |
|---|---|---|---|---|
| 1 | 55 | 60 | +5 | D |
| 2 | 62 | 67 | +5 | D |
| 3 | 70 | 75 | +5 | C |
| 4 | 78 | 83 | +5 | B |
| 5 | 85 | 90 | +5 | A |
Grade Curve Calculator: How to Curve Grades and Test Scores
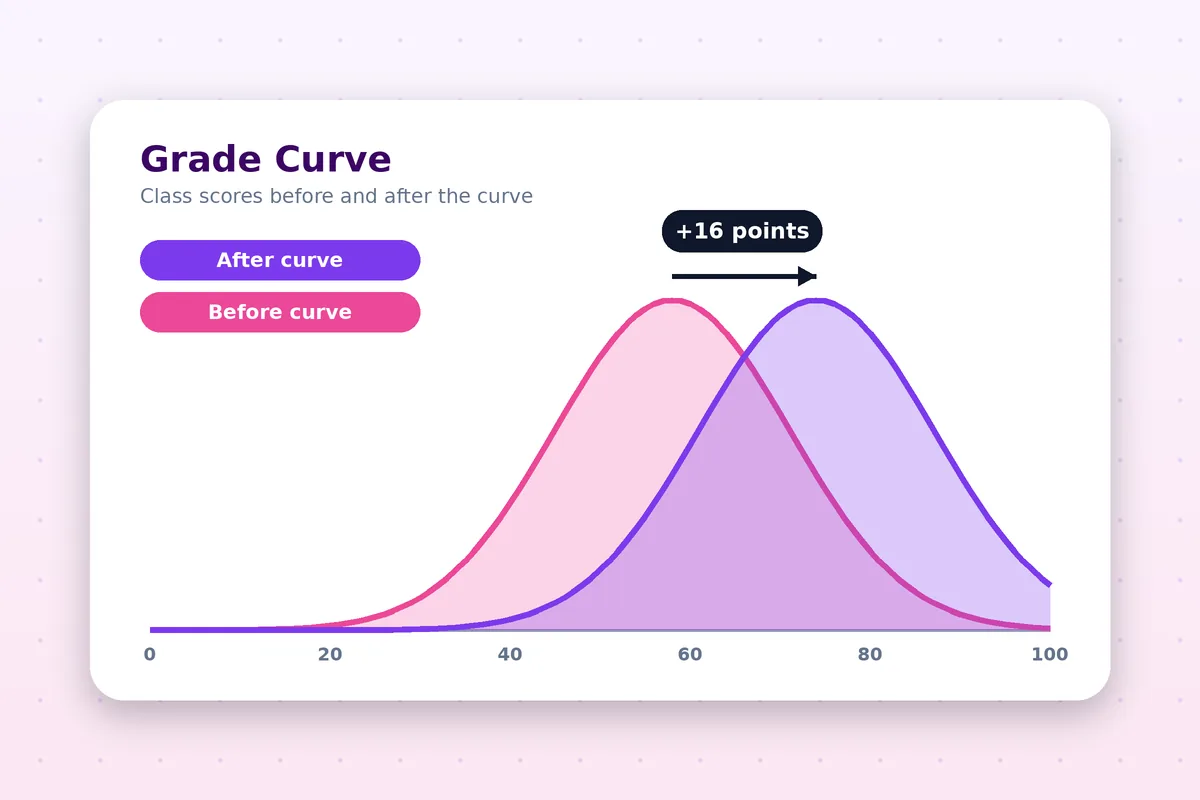
A grade curve calculator adjusts raw test scores with a rule applied to every student, then shows the before-and-after scores, the class mean and median, and the letter grade each student ends up with. It helps teachers choose a fair curve and helps students estimate what a curve might do. This free online tool curves four ways and works for any maximum score.
What Is a Grade Curve?
Curving means changing raw scores with one consistent rule, usually because a test turned out harder than intended or a question was unclear. It is an instructor decision, not something a student can claim.
Curve vs. bell curve
The four methods below move every score by a fixed rule, so the order of students and the gaps between them stay recognizable. A bell-curve policy assigns letters by rank or by distance from the class mean and standard deviation, which can leave some students lower than their raw score. This calculator never lowers a score.
How to Curve Grades: The Four Methods
How do you grade on a curve with flat points?
Add the same number of points to everyone: curved score = raw score + k. A +5 curve turns a 70 into a 75 and keeps every gap between students the same, which makes it a linear grade curve.
How do you curve a test so the top score is 100?
Add the difference between the maximum score and the highest raw score: curved score = raw score + (maximum − highest score). If the best score was 85 out of 100, everyone gains 15 points.
What is a square root grade curve?
For a 100-point test, curved score = 10 × √raw score. A 64 becomes 80 and a 36 becomes 60, so low scores gain the most and the spread of the class narrows. A cube-root curve works the same way with a stronger lift, but this calculator offers the square root.
How do you curve grades using the class average?
Shift every score by the gap between your target mean and the actual mean: curved score = raw score + (target − mean). If the class mean is 64 and the department expects 75, add 11 points to each score, so a 58 becomes 69.
Grade Curve Calculator with Mean, Median and Standard Deviation
How do I find the class mean and median?
The mean is the sum of all scores divided by the number of scores, and the median is the middle score once they are sorted. For 55, 62, 70, 78 and 85 both come to 70. The calculator shows the mean and median before and after the curve, so you can see how far each method moves the class.
How do I curve grades using the mean and standard deviation?
Convert each score to a z-score, (score − mean) ÷ standard deviation, then rebuild it with the mean and spread you want: new score = target mean + target spread × z. With a class mean of 70 and a standard deviation of 10, an 80 has z = 1, so a target mean of 78 and spread of 8 gives 86. This calculator does not compute standard deviation, so work that step out in a spreadsheet with STDEV and use the target-average method here when you only need to move the mean.
How to Use the Grade Curve Calculator
- Paste the raw scores, one per line or separated by commas.
- Set the maximum score if the test was not out of 100 points.
- Choose a curving method and enter its setting (points to add, or the target average).
- Decide whether scores should be capped at the maximum.
- Compare the before-and-after table, the mean, the median and the letter grades, then print the result.
Grade Curve Calculator from Points, for Exams and Final Grades
How do I curve a test that is not out of 100?
Enter the points the test was worth as the maximum score. The square-root curve then becomes maximum × √(raw ÷ maximum), so a 36 on a 50-point test becomes 42.4, and the cap and top-score method use your maximum too.
Can I curve a final exam or a final grade?
Yes. Paste the final exam scores and apply the curve, then enter the curved scores in the weighted grade calculator to see course grades. Many schools curve single assessments rather than the finished course grade, so check the policy first.
What is my letter grade after the curve?
Every curved score in the results table carries a letter on the A–F or plus/minus scale. A raw 74 with a +8 curve becomes 82, which is a B on the A–F scale and a B- on plus/minus.
Choosing a Fair Curve
- Use flat points when one question was ambiguous or a topic was not taught.
- Use top score to 100 when the test was harder than intended and nobody reached full marks.
- Use the square-root curve when many scores are low and you want to lift the bottom most.
- Use the target average when your department expects a particular class mean.
Capping at the maximum hides what happens at the top: scores of 97 and 99 can both become 100 after a +5 curve. View the uncapped values first, then decide what your gradebook should record.
How to Grade on a Curve in Excel or Google Sheets
Put the raw scores in column A. A flat +5 curve capped at 100 is =MIN(100, A2+5), a target average of 78 is =MIN(100, A2+(78-AVERAGE($A$2:$A$30))), and the square-root curve is =10*SQRT(A2). Fill the formula down the column. The calculator does the same sum without setup and adds the mean, median and letters.
Curved Grades and the Gradebook
After curving, enter the curved scores in the weighted grade calculator to see course grades, and check the cutoffs behind each letter with the letter grade calculator. Teachers can compare all four curves on the same class before posting grades, and students in high school or college can paste the scores they know to estimate the effect. The official curve is always the instructor’s decision.
Grade Curve Calculator FAQs
Answers on the four curving methods, class mean and median, capping at 100 and how a curve changes each student’s letter grade.
Interactive Tools Available
Paste your class scores above and compare all four curving methods side by side.
Related grade calculators
- Test grade calculatorPercentage and letter for one test, with bonus points.
- Letter grade calculatorSee the cutoffs behind each letter.
- Weighted grade calculatorTurn curved scores into a course grade.
- Quick Grade chartPrint a score chart for a stack of tests.
- Average grade calculatorMean and median for a list of scores.